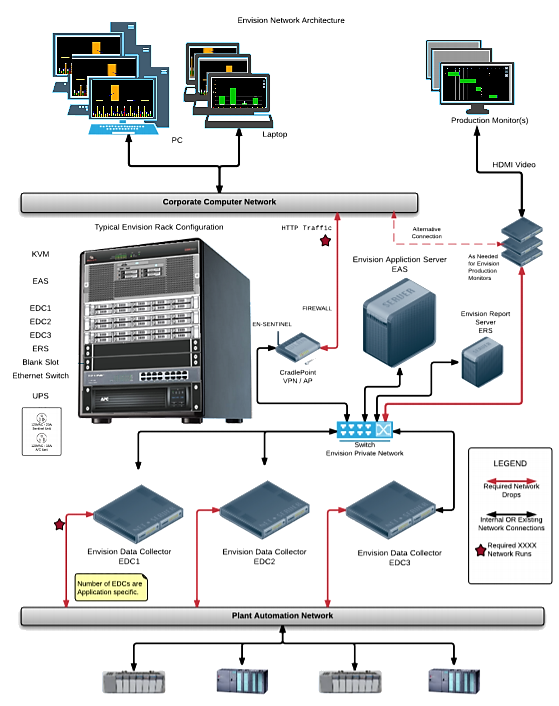
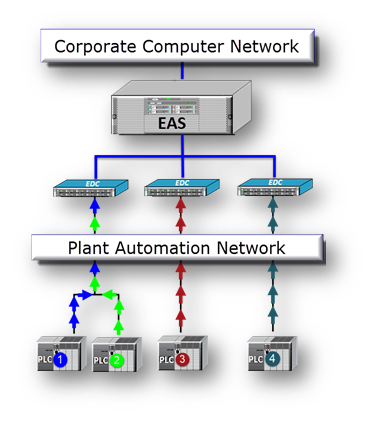
Envision Application Server (EAS)
EAS receives the data and information to display the complete data taken. It receives data from the EDC which is in contact with the PLCs.
Components of EDC
OPC Server (OLE Process Control)
Object linking and embedding (OLE) is a Microsoft technology that facilitates the sharing of application data and objects written in different formats from multiple sources. Linking establishes a connection between two objects, and embedding facilitates application data insertion.
Object Linking and Embedding (OLE) for process control (OPC) is a set of standards developed by a joint collaboration of leading automation industry suppliers. OPC's primary mission is to define a uniform interface for use with any organization or custom software package.
Makes it possible to understand and unify the communications between machines.
Agent
The Agent is a service program, that allows the EDC to talk to EAS. The EAS cannot talk to EDC directly. The agents initiate communication through the web API's (application programming interface) to the EAS to find out what it has to do. The Agent asks the EAS if it needs anything. If the EAS has a job to do, it tells the EDC, and the EDC will start to perform the job. If it needs more information on the job, it will ask the EAS for the necessary information (such as deployment). When asked by the EDC, the EAS will say it needs to deploy, so the agent executes the Deployment instructions.
Data logger
Data Logger is an application of the EDC that logs data from an OPC server to any ODBC-compliant database.
Data logger monitors for any data changes in the PLC. It will log the changes through the database and staging the data in a temporary storage area. The data will be accessed and processed by the Data Processor when ready.
Data processor
The Data Processor performs the real work and performed the complicated functions needed to complete the process. The Data Processor looks at the data that comes in through the system and the Data logger. It takes the data, organizes it, makes sense of it, and identifies the cycle data. It then analyzes the data, Envisionizes it (structures it) and sends it to the Envision Application Server. From there the data can be accessed through the Envision Browser.